
Sanmenxia Lerenjia Food Co., Ltd. 2020 Product Carbon Footprint Report
1 Summary
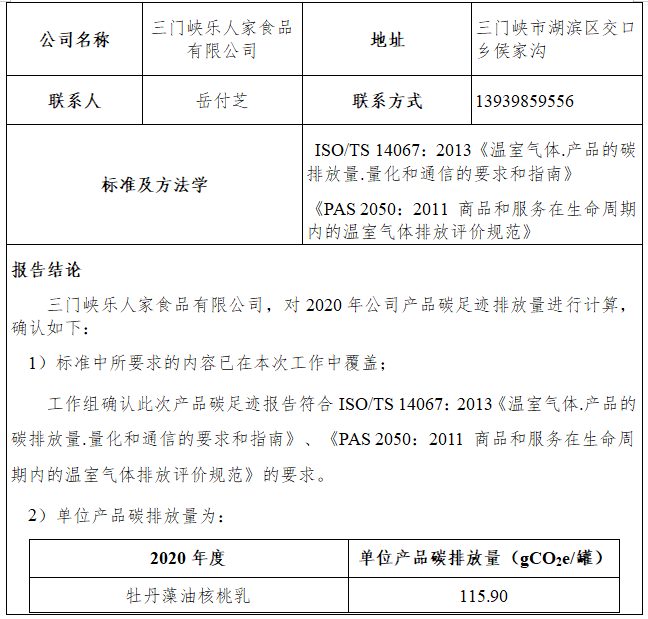
This project was executed by Sanmenxia Lerenjia Food Co., Ltd. The purpose of the evaluation is to calculate the carbon footprint of Sanmenxia Lerenjia Food Co., Ltd.'s Peony Algae Oil Walnut Milk product based on the life cycle assessment method, using the carbon footprint accounting methods specified in ISO/TS 14067:2013 "Greenhouse gases — Carbon footprint of products — Requirements and guidelines for quantification and communication" and PAS 2050:2011 "Specification for the assessment of the life cycle greenhouse gas emissions of goods and services."
To meet the communication needs of various stakeholders regarding the carbon footprint, the functional unit of this report is defined as the production of 1 can of Peony Algae Oil Walnut Milk. The system boundary is of the "cradle-to-gate" type. On-site investigations covered the life cycle from raw material extraction, raw material production, raw material transportation, product manufacturing, product packaging, product transportation to the client, and waste recycling. Emission factor data for other materials and energy acquisition were sourced from the China Life Cycle Database (CLCD) and the Swiss Ecoinvent database.
The report compares and analyzes the differences in the proportion of carbon footprints for different unit processes in production and the cumulative proportion of carbon footprints for each production process. From the contribution of individual processes to the carbon footprint, it was found that the raw material production process contributes the most to the product's carbon footprint.
During the evaluation process, data quality was considered one of the most important factors. The guiding principle for data collection and selection was to ensure data representativeness as much as possible, mainly reflected in producers, technology, region, and time. Life cycle main activity data were sourced from primary data collected through on-site enterprise surveys. Most emission factor data for domestically produced raw materials came from the IPCC database, as well as the China Life Cycle Database (CLCD) and the Swiss Ecoinvent database. The data selected for this evaluation are highly recognized and widely used in domestic and international LCA studies. Additionally, the eFootprint software was used to model, calculate, and analyze the product's life cycle to ensure data and calculation results are traceable and reproducible.
2 Introduction to Product Carbon Footprint (PCF)
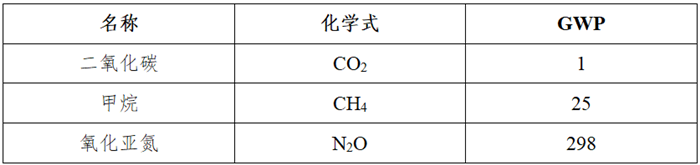
In recent years, the greenhouse effect and climate change have become global concerns, and the new term "carbon footprint" has been increasingly used worldwide. Carbon footprints are generally divided into three levels: project level, organizational level, and product level. Product Carbon Footprint (PCF) refers to the total greenhouse gas emissions of a product throughout its life cycle stages, including raw material extraction, product manufacturing (or service provision), distribution, use, and final disposal/recycling. Greenhouse gases include carbon dioxide (CO2), methane (CH4), nitrous oxide (N2O), hydrofluorocarbons (HFCs), and perfluorocarbons (PFCs). The carbon footprint calculation result is the weighted sum of various greenhouse gas emissions during the product life cycle, expressed in carbon dioxide equivalent (CO2e), with units of kg CO2e or g CO2e. Global Warming Potential (GWP), the carbon dioxide equivalent value of various greenhouse gases, usually adopts values provided by the Intergovernmental Panel on Climate Change (IPCC)[1]. This set of factors (characterization factors) is widely applicable worldwide.
Product carbon footprint calculation only includes the greenhouse gas portion of a complete Life Cycle Assessment (LCA)[2]. Based on LCA evaluation methods, multiple international carbon footprint assessment guidelines and requirements have been established for product carbon footprint certification. Currently, three widely used carbon footprint assessment standards are: ① PAS 2050:2011 "Specification for the assessment of the life cycle greenhouse gas emissions of goods and services," jointly issued by the British Standards Institution (BSI), Carbon Trust, and the UK Department for Environment, Food & Rural Affairs (Defra). It is the earliest international standard with specific calculation methods and is currently one of the most used product carbon footprint evaluation standards[3]; ② "Greenhouse Gas Protocol: Product Life Cycle Accounting and Reporting Standard," issued by the World Resources Institute (WRI) and the World Business Council for Sustainable Development (WBCSD); ③ ISO/TS 14067:2013 "Greenhouse gases — Carbon footprint of products — Requirements and guidelines for quantification and communication," developed by the International Organization for Standardization (ISO) based on PAS 2050 as a seed document[4]. The emergence of product carbon footprint accounting standards aims to establish a consistent and internationally recognized method for assessing product carbon footprints.
3 Goal and Scope Definition
3.1 Company and Product Introduction
Sanmenxia Lerenjia Food Co., Ltd. was established in December 2014 with a registered capital of 20 million yuan. It is located in the Jiaokou area of Hubin Industrial Park, Sanmenxia City, Henan Province. The company mainly engages in the research, development, production, and sales of pre-packaged foods, beverages, solid drinks, meal replacement foods, convenience foods, tea and related products, and pastries. It has developed 12 technological achievements and registered 52 food batch numbers. The factory covers an area of 42 mu, with a comprehensive office building, staff dormitory, R&D testing center, standardized workshops, and supporting facilities, with a total building area of 283,000 square meters.
3.2 Evaluation Purpose
The purpose of this evaluation is to obtain the carbon footprint of the entire life cycle process for producing 1 can of Peony Algae Oil Walnut Milk.
Carbon footprint accounting is the foundation and key for Sanmenxia Lerenjia Food Co., Ltd. (hereinafter referred to as Lerenjia) to achieve low-carbon and green development. Disclosing the product's carbon footprint is part of Lerenjia's environmental protection efforts and social responsibility, and also an important step for Lerenjia to enter the international market. The evaluation results of this project will provide a good channel for effective communication between Lerenjia's Peony Algae Oil Walnut Milk product purchasers and third parties, and will have a positive effect on promoting greenhouse gas reduction throughout the product's entire supply chain.
The potential communication targets of this project's evaluation results include two groups: first, Lerenjia's internal management and other related personnel; second, external stakeholders such as upstream suppliers, downstream purchasers, local governments, and environmental non-governmental organizations.
3.3 Evaluation Boundary
According to the purpose of this project evaluation and in accordance with the relevant requirements of ISO/TS 14067:2013 "Greenhouse gases — Carbon footprint of products — Requirements and guidelines for quantification and communication" and PAS 2050:2011 "Specification for the assessment of the life cycle greenhouse gas emissions of goods and services," the boundary of this carbon footprint evaluation covers all production and non-production activities of Sanmenxia Lerenjia Food Co., Ltd. for producing 1 can of Peony Algae Oil Walnut Milk throughout the year 2020. Therefore, the evaluation boundary is defined as: product carbon footprint = raw material production and transportation + process production + packaging and transportation + waste recycling.
3.4 Functional Unit
For convenient quantification of system inputs/outputs, the functional unit is defined as the production of 1 can of Peony Algae Oil Walnut Milk.
3.5 Life Cycle Flowchart Drawing
According to the "PAS2050:2011 Specification for the assessment of the life cycle greenhouse gas emissions of goods and services," a life cycle flow chart of one can of Peony Algae Oil Walnut Milk product is drawn. Its carbon footprint assessment model is from business to business (B2B): including raw material extraction and transportation, product manufacturing, packaging, transportation to distributors.
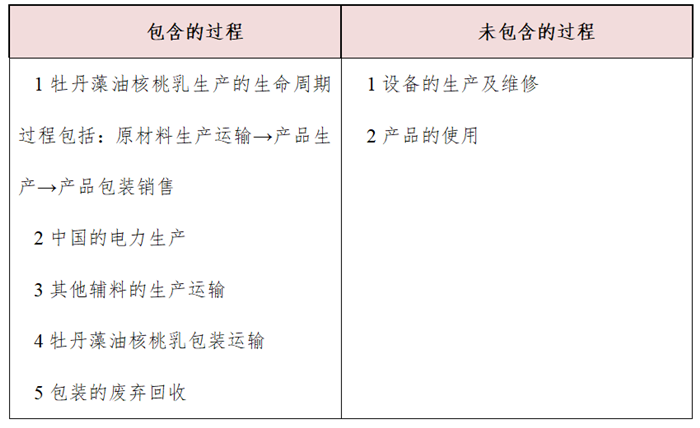
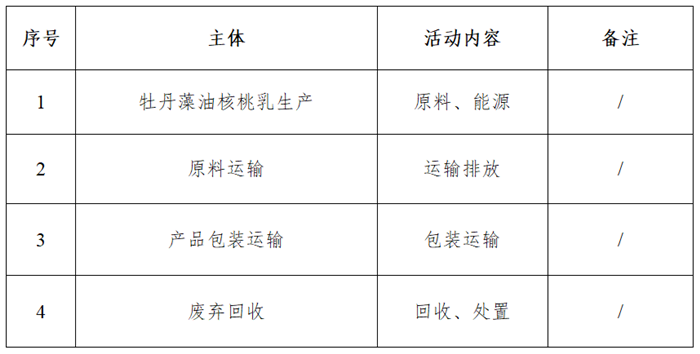
In this report, the product system boundary belongs to the "cradle to gate" type. To achieve the above functional unit, the system boundary of the Peony Algae Oil Walnut Milk product is shown in the table below:
Table 3.1 Production processes included and excluded within the system boundary
3.6 Allocation Principles
Since no by-products are generated in the production process of Peony Algae Oil Walnut Milk under this assessment system boundary, and the energy consumption for producing this product is not separately measured, the carbon footprint accounting uses average allocation based on product quantity or cost conversion.
3.7 Cut-off Criteria
The cut-off rules adopted in this assessment are based on the weight ratio of each raw material input to the product weight or total process input weight. The specific rules are as follows:
When the weight of ordinary materials is less than 1% of the product weight, and the weight of materials containing rare or high-purity components is less than 0.1% of the product weight, the upstream production data of these materials can be ignored; the total ignored material weight does not exceed 5%;
Production equipment, factory buildings, living facilities, etc., can be ignored;
Known emission data within the selected environmental impact categories should not be ignored.
All raw and auxiliary materials and energy consumption in this report are linked to upstream data, and some upstream data of consumption are handled by approximate substitution.
3.8 Impact Types and Assessment Methods
Based on the definition of the assessment goal, this evaluation only selects global warming as the impact type and analyzes the Global Warming Potential (GWP) of the product life cycle, because GWP is the environmental impact indicator used to quantify the product carbon footprint.
During the assessment, various greenhouse gases were counted, including carbon dioxide (CO2), methane (CH4), nitrous oxide (N2O), tetrafluoromethane (CF4), hexafluoroethane (C2F6), sulfur hexafluoride (SF6), and hydrofluorocarbons (HFCs). The method proposed by the IPCC Fourth Assessment Report (2007) was used to calculate the GWP value of the product production cycle. This method is based on the relative radiative forcing values of other greenhouse gases compared to carbon dioxide over a 100-year time horizon, called characterization factors, which convert emissions of other greenhouse gases into CO2 equivalents (CO2e). For example, 1 kg of methane has the same global warming impact over 100 years as 25 kg of carbon dioxide emissions, so the characterization factor for methane is 25 kg CO2e[1].
3.9 Software and Databases
This assessment uses the eFootprint software system to establish the life cycle model of Peony Algae Oil Walnut Milk and calculate the LCA results. The eFootprint software system is an online LCA analysis software developed by Chengdu Yike Environmental Technology Co., Ltd., supporting full life cycle process analysis and built-in with the China Life Cycle Database (CLCD), the EU ELCD database, and the Swiss Ecoinvent database.
The databases used in the assessment, including CLCD and Ecoinvent, contain production and disposal process data summarized as "cradle to customer" data, described as follows:
The China Life Cycle Database (CLCD) was developed by Chengdu Yike Environmental Technology Co., Ltd. It is an industry average database based on the core model of China's basic industrial system life cycle. The CLCD database includes inventory datasets of major domestic energy, transportation, and basic raw materials, among which electricity (including thermal power, hydropower, and mixed power transmission) and road transportation related basic data are adopted in this assessment. In 2009, the CLCD database research was awarded the Life Cycle Research Award by the United Nations Environment Programme (UNEP) and the Society of Environmental Toxicology and Chemistry (SETAC).
The Ecoinvent database was developed by the Swiss Life Cycle Research Center, with data mainly sourced from Switzerland and Western European countries. This database contains about 4,000 datasets of products and services, covering energy, transportation, building materials, electronics, chemicals, pulp and paper, waste treatment, and agricultural activities.
3.10 Data Quality Requirements
To meet data quality requirements, the following aspects are mainly considered in this assessment:
Data accuracy: the reliability of real-world data;
Data representativeness: representativeness of producers, technology, region, and time;
Model consistency: the degree of consistency in methods and system boundaries.
To meet the above requirements and ensure the reliability of calculation results, primary data directly provided by producers and suppliers are prioritized during the assessment. The average value of enterprise-provided empirical data is taken. This assessment conducted investigation, collection, and collation of enterprise on-site data. When primary data are unavailable, secondary data representing regional averages and specific technical conditions are selected, mostly from the IPCC database; when no fully consistent secondary data exist in current databases, approximate substitution using IPCC data is adopted.
The eFootprint software is used to establish the product life cycle model, calculate the carbon footprint, and analyze the results. The databases used during the assessment process include the China Life Cycle Database (CLCD) and the Swiss Ecoinvent database.
The database data have been strictly reviewed and widely applied in domestic and international LCA studies. Each dataset and data quality will be detailed in Chapter 4 when introducing each process.
4 Process Description
4.1 Peony Algae Oil Walnut Milk Production Process
(1) Basic Process Information
Process Name: Peony Algae Oil Walnut Milk Production
Process Boundary: From raw material extraction and transportation to Peony Algae Oil Walnut Milk production process
(2) Data Representativeness
Main Data Source: Actual production data of the enterprise in 2020
Enterprise Name: Sanmenxia Lerenjia Food Co., Ltd.
Production Location: Sanmenxia City, Henan Province, China
Base Year: 2020
Main Raw Materials: Walnut kernels, white sugar, black sesame paste, food additives
Main Energy Consumption: Electricity, natural gas
The main production process is introduced as follows:
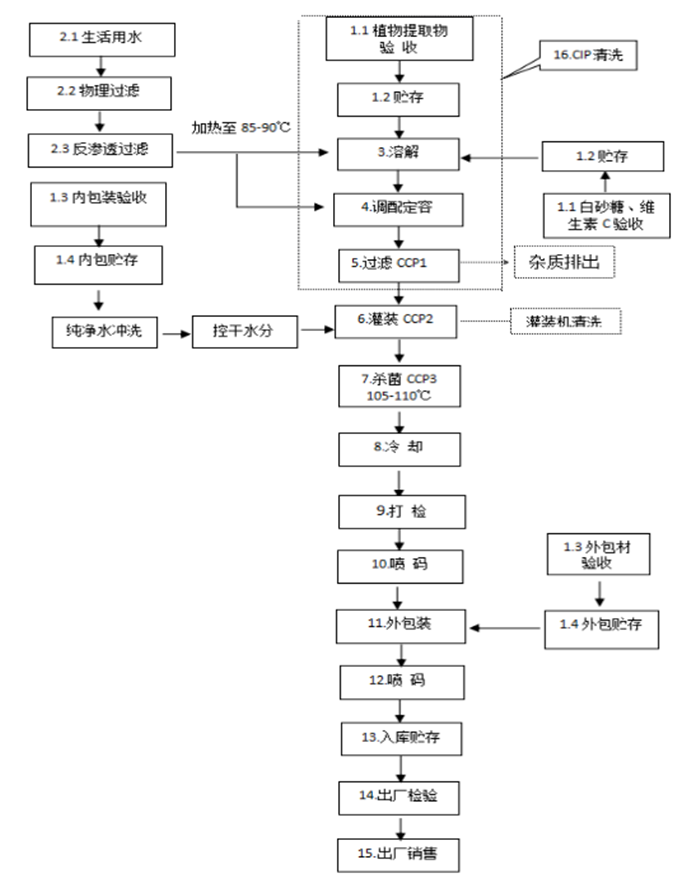
Figure 4.1 Product Production Flowchart
Process Description:
(1) Raw and Auxiliary Materials Acceptance and Storage
1) Raw and Auxiliary Materials Acceptance, 2) Raw and Auxiliary Materials Storage, 3) Packaging Materials Acceptance, 4) Packaging Materials Storage
(2) Water Treatment
1) Raw Water: Raw water should comply with GB5749 "Standards for Drinking Water".
2) Physical Filtration: Drinking water is first filtered through activated carbon and quartz sand to remove impurities.
3) Reverse Osmosis Filtration: Water filtered physically is further filtered by secondary reverse osmosis and used as ingredient water. The conductivity of primary reverse osmosis should be ≤20µs/cm2, and secondary reverse osmosis should be ≤10µs/cm2.
(3) Raw and Auxiliary Materials Dissolution
1) Plant Extract Dissolution: Accurately weigh the plant extract according to the formula requirements, dissolve it in reverse osmosis water at about 80-85°C, filter through a 5µm mesh, and pour into the mixing tank.
2) White Sugar and Auxiliary Materials: Dissolve in reverse osmosis water, filter through a 5µm mesh, pour into the mixing tank, and adjust volume as required.
(4) Mixing and Volume Adjustment: The volume-adjusted solution is directly poured into the high-level tank.
(5) Filtration: Material in the high-level tank is filtered through a 100 mesh filter and then poured into the filling machine for filling.
(6) Hot Filling and Capping: Material filtered through the mesh is filled and capped. Filling temperature should not be lower than 90 degrees.
(7) Sterilization: Sterilization temperature: 105-110°C, 30 minutes.
(8) Cooling: Purified water circulates for cooling, lowering temperature to 25-30°C.
(9) Automatic Inspection: Automatic inspection removes deformed or swollen cans that do not meet standards.
(10) Coding: Print production date and batch number on the bottom of the can. The code must be clear and complete.
(11) Cartoning
According to the size of the carton, place the products neatly in the carton in the specified quantity. The carton mouth should be sealed tightly, and the sealing tape should extend beyond the front of the carton, leaving about 5cm on the side. It should not be too long or too short. After packing, ensure the carton is clean, tidy, intact, and undamaged, with no deformation or damage. Filled and sealed products should be placed in matching cartons according to specifications and quantity.
(12) Outer Carton Coding: Coding should follow the format **Year**Month**Day, and the code must be clear.
(13) Warehousing and Storage
Finished products entering the warehouse must be properly labeled. The warehouse should be kept clean, dry, ventilated, fireproof, rodent-proof, and pollution-free. Products should be placed off the wall and ground, following the first-in, first-out principle.
(14) Factory Inspection: Inspectors conduct factory inspection according to product standards. After passing inspection, a factory inspection report for the batch is issued before sales.
(15) Factory Sales:
Transport vehicles must be clean, tidy, and uncontaminated, covered with tarpaulin. They must not transport toxic or harmful substances together. Products can only be sold after passing inspection. Sales records must be filled out during product sales.
5 Data Collection and Main Emission Factors Explanation
To calculate the product's carbon footprint, activity level data, emission factor data, and Global Warming Potential (GWP) must be considered. Activity level data refers to all quantified data during the product lifecycle (including material inputs and outputs; energy use; transportation, etc.). Emission factor data refers to the amount of greenhouse gases emitted per unit of activity level data. Using emission factor data, activity level data can be converted into greenhouse gas emissions. For example, the emission factor for electricity can be expressed as CO2e/kWh. GWP is a coefficient relating the radiative forcing impact of a unit mass of a greenhouse gas (GHG) over a given time period to that of an equivalent mass of CO2, such as CH4 (methane) with a GWP value of 25. Activity level data comes from on-site measurements; emission factors use IPCC prescribed default values. Activity level data mainly includes purchased electricity, natural gas, walnut kernels, white sugar, black sesame paste consumption, etc. Emission factor data mainly includes emission factors for purchased electricity, natural gas, walnut kernels, white sugar, black sesame paste production, etc.
6 Carbon Footprint Calculation
6.1 Carbon Footprint Identification
Table 6.1 Carbon Footprint Process Identification Table
6.2 Calculation Tables
6.2.1 Production Process Data List for Peony Algae Oil Walnut Milk (1 Can)
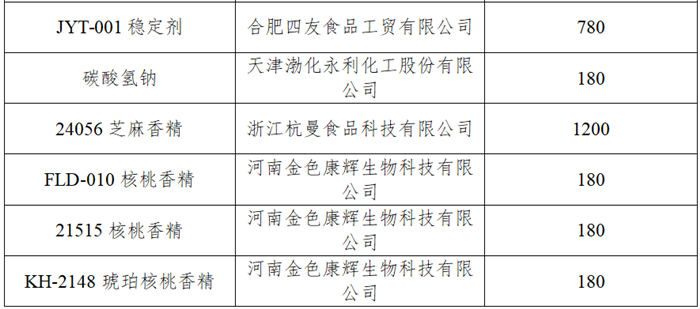
Table 6.2 Production Data List for Peony Algae Oil Walnut Milk (1 Can)
[ Due to minor raw material losses during production, to ensure data completeness, this report uses the actual weight of raw materials when calculating raw material consumption ]
| Type |
List |
Purpose |
Production / Consumption |
Unit |
Upstream Emission Factor Source |
| Product |
Peony Algae Oil Walnut Milk |
Product |
1 |
t |
— |
| Consumption |
Walnut Kernels |
Raw Material |
0.03540 |
t |
CLCD |
| Black Sesame |
Raw Material |
0.00303 |
k g |
CLCD |
|
| White Sugar |
Raw Material |
0.06574 |
k g |
CLCD |
|
| Honey |
Raw Material |
0.00101 |
k g |
CLCD |
|
| Danfeng Peony Hua Extract |
Raw Material |
0.00005 |
k g |
Consumption does not exceed the total product mass 0.1% |
|
| Peony Seed Oil |
Raw Material |
0.00003 |
k g |
||
| Arachidonic Acid Oil ARA |
|
0.00003 |
k g |
||
| DHA Algal Oil S35-0300 |
|
0.00002 |
k g |
||
| y- Gamma-Aminobutyric Acid |
|
0.00002 |
k g |
||
| Phospholipid Serine |
|
0.00002 |
k g |
||
| Carrot Juice |
|
0.00000 |
k g |
||
| JYT-001 Stabilizer |
|
0.00364 |
k g |
CLCD |
|
| Sodium Bicarbonate |
|
0.00061 |
k g |
CLCD |
|
| 24056 Sesame Flavor |
|
0.00005 |
k g |
Consumption does not exceed the total product mass 0.1% |
|
| FLD-010 Walnut Flavor |
|
0.00015 |
k g |
CLCD |
|
| 21515 Walnut Flavor |
|
0.00071 |
k g |
CLCD |
|
| KH-2148 Amber Walnut Flavor |
Raw Material |
0.00020 |
k g |
CLCD |
|
| Electricity |
Energy |
0.0449 |
kWh |
CLCD |
|
| Natural Gas |
Energy |
0.0013 |
m 3 |
CLCD |
|
| Emissions |
CO 2 |
Emissions |
610.45 |
k g |
IPCC Carbon Verification Data |
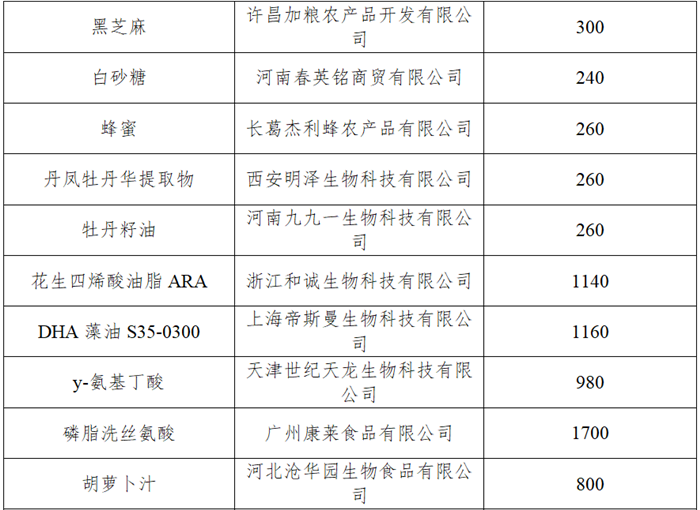
6.2.2 Main Raw Material Origins
Table 6.3 Main Raw Material Origins
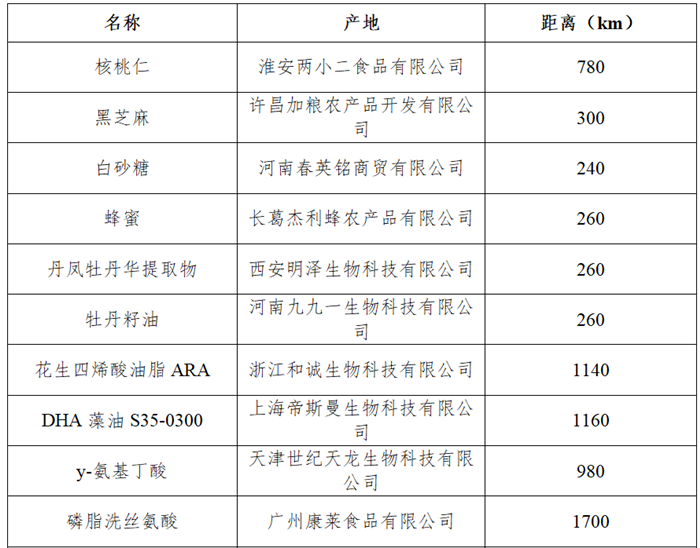
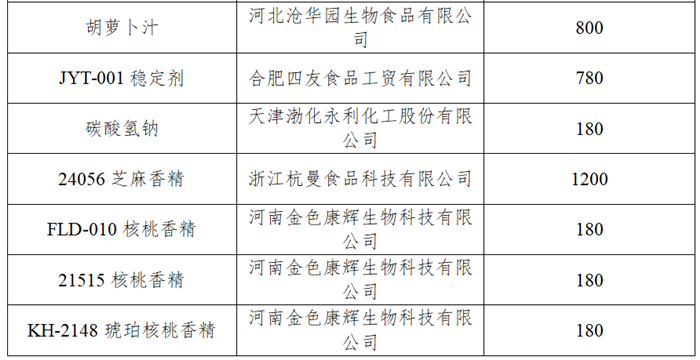
6.2.2 Main Raw Material Origins
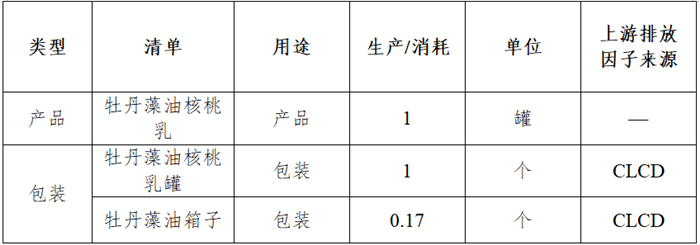
6.3 Packaging and Transportation
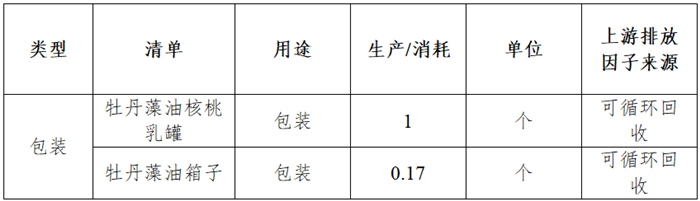
6.4 Waste and Recycling
 7 Data Calculation
7.1 Calculation Formula
1. Carbon dioxide emission equivalent is the product of the emission factor and the activity level based on that factor:
Ei=Ai×EFi (1)
In the formula,
Ei is the carbon dioxide emissions of activity i, in tons;
Ai is the activity level of activity i (e.g., electricity consumption, kWh);
Ei is the emission factor of activity i, i.e., the amount of carbon dioxide emitted per unit of electricity produced. The units of emission factors vary with different activity levels.
Table 7.1 CO 2、 CH 4、 N 2 O Global Warming Potential
2. The total carbon dioxide emission equivalent calculation formula is: E =Σ i A i × EF i (2)
Methane and nitrous oxide emission equivalents are the product of emission factors, activity levels based on those factors, and global warming potentials: E ij = A ij × EF ij × GWP j (3)
In the formula,
E ij For the i th activity's j th greenhouse gas emissions (t) ;
A ij For the i The activity level of the j th greenhouse gas of the ( activity, such as electricity consumption, kWh) ;
E ij For the i The emission factor of the j th greenhouse gas of the
GWP j For the j activity, i.e., the amount of carbon dioxide emitted per unit activity. The units of emission factors vary with different unit activities;
Global warming potential of the greenhouse gas. E =Σ i Total carbon dioxide emission equivalent j A ij × EF ij × GWP j (4)
7.2 Calculation Results
Table 7.2 Production 1 Can Peony Algae Oil Walnut Milk Emission Table
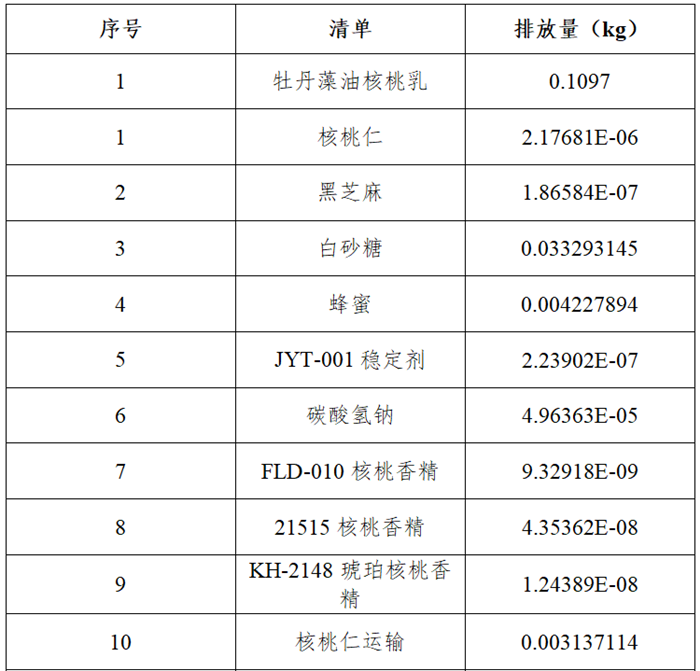
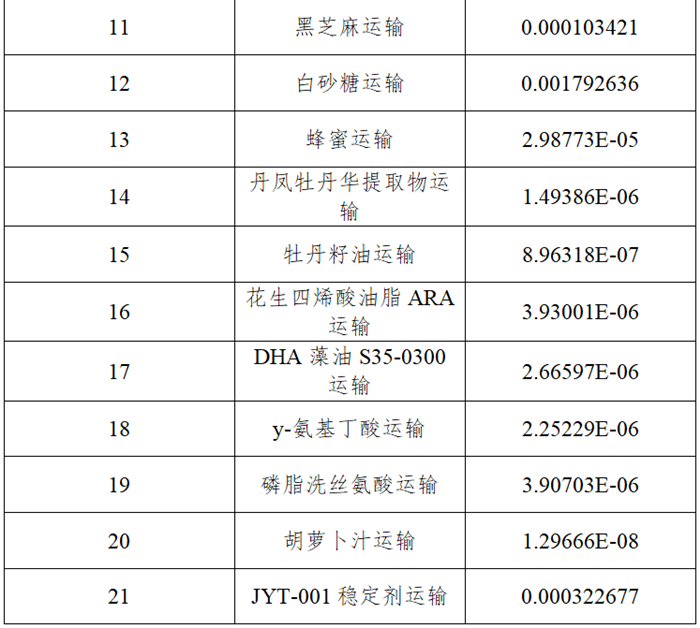
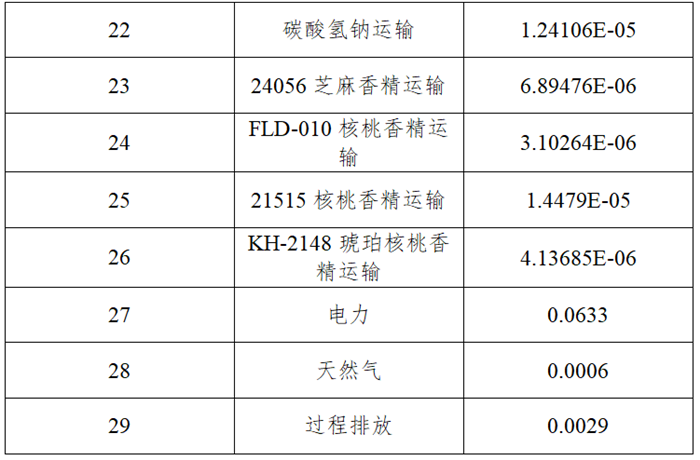
Table 7.3 Production 1 Can Peony Algae Oil Walnut Milk Packaging and Transportation Emission Table
 Table 7.4 Production 1 Can Peony Algae Oil Walnut Milk Waste and Recycling Emission Table
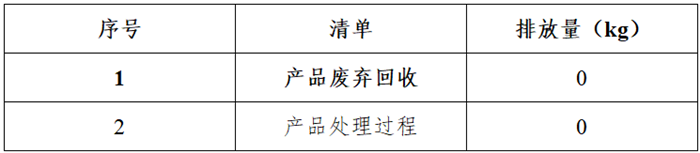 Table 7.5 Production 1 Can Peony Algae Oil Walnut Milk Emission Table
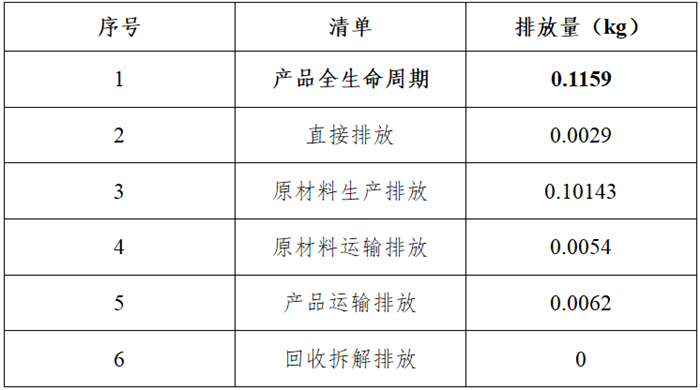
According to formula (4), the carbon footprint of 1 can of Peony Algal Oil Walnut Milk is calculated as e=115.90gCO2e. From the cumulative carbon footprint contribution ratio of the Peony Algal Oil Walnut Milk lifecycle, it can be seen that the carbon emission stages mainly concentrate on raw material production and the production process emissions.
Therefore, to reduce the carbon footprint of Peony Algal Oil Walnut Milk, focus should be on reducing the carbon footprint of its raw materials. Using raw materials sourced from closer distances and reducing material consumption under feasible enterprise conditions are important approaches. Additionally, electricity emissions account for more than 54% of energy consumption emissions, so it is recommended to use new energy sources such as photovoltaic power projects and other clean energy to reduce carbon dioxide emissions.
To reduce the product carbon footprint, the following suggestions are made:
1) Effectively reduce fuel consumption during transportation by changing the product transportation method and improving the efficiency of each transport.
2) Reduce raw material consumption and improve material utilization rate. At the same time, where the process allows, use raw materials with lower greenhouse gas impact as substitutes;
3) Strengthen energy-saving efforts, improve energy efficiency from both technical and management levels, reduce energy input, and consider implementing energy-saving renovations within the plant, focusing on improving energy utilization to reduce energy consumption;
4) Based on the conformity evaluation results of analysis indicators and carbon footprint analysis and calculation results, combined with environmentally friendly design schemes, implement extended producer responsibility systems, green supply chain management, and propose specific plans for product eco-design improvements;
5) Continue to promote awareness of green and low-carbon development, firmly establish the principle of sustainable enterprise development, and strengthen the promotion and practice of lifecycle concepts. Use scientific methods to enhance the accumulation and recording of data throughout the product carbon footprint process, regularly conduct self-inspections of the environmental impact of the product lifecycle to facilitate internal comparative analysis and problem identification. Further improve eco-design management, organization, and personnel aspects;
6) Promote the green design development of the industrial chain, establish eco-design management systems and regulations, clarify task divisions; build an evaluation system supporting enterprise eco-design; establish related systems for creating a green supply chain and promote collaborative improvements in the supply chain.
8 Uncertainty Analysis
The main sources of uncertainty are measurement errors and calculation errors in primary data. Methods to reduce uncertainty mainly include:
Use primary data with higher accuracy;
Track and monitor energy consumption for every process step to improve the accuracy of primary data.
9 Conclusion
Sanmenxia Lerenjia Food Co., Ltd. produces 115.90g CO2e per can of Peony Algae Oil Walnut Milk product, with electricity production accounting for the largest share of raw material consumption at 54%; raw material production emissions account for 87.5%; production process accounts for 2.5%; raw material transportation accounts for 4.66% of total emissions. The company can reduce carbon emissions of the product by technological process improvements to reduce energy and raw material consumption.
The product carbon footprint report for chemical enterprises is an inevitable choice for their future survival and development. Enterprises conduct product carbon footprint accounting to achieve greenhouse gas management and formulate low-carbon development strategies. Through carbon footprint accounting of the product lifecycle, enterprises can understand emission sources, clarify emissions at each production stage, and lay the foundation for setting reasonable emission reduction targets and development strategies.
References:
[1]. IPCC 2007: the Fourth Assessment Report of the Intergovernmental Panel on Climate Change.
[2]. Product Carbon Footprint Memorandum, Position statement on measurement and communication of the product carbon footprint for international standardization and harmonization purposes, Berlin, December 2009.
[3]. ISO/TS 14067: 2013, Greenhouse Gases—Carbon Footprint of Products—Requirements and Guidelines for Quantification and Communication[J]. International Organization for Standardization, Geneva, Switzerland, 2013.
[4]. BSI, The Guide to PAS 2050: 2011, How to carbon footprint your products, identify hotspots and reduce emissions in your supply chain.
Hotline
Email: btgj6666@163.com
Address: Houjiagou, Jiaokou Township, Hubin District, Sanmenxia City

Copyright © Sanmenxia Lerenjia Food Co., Ltd.
Powered by :www.300.cn Supported IPV6 Privacy Agreement